Seismograph AM.R24AE
The instrumentRecording
How to read it
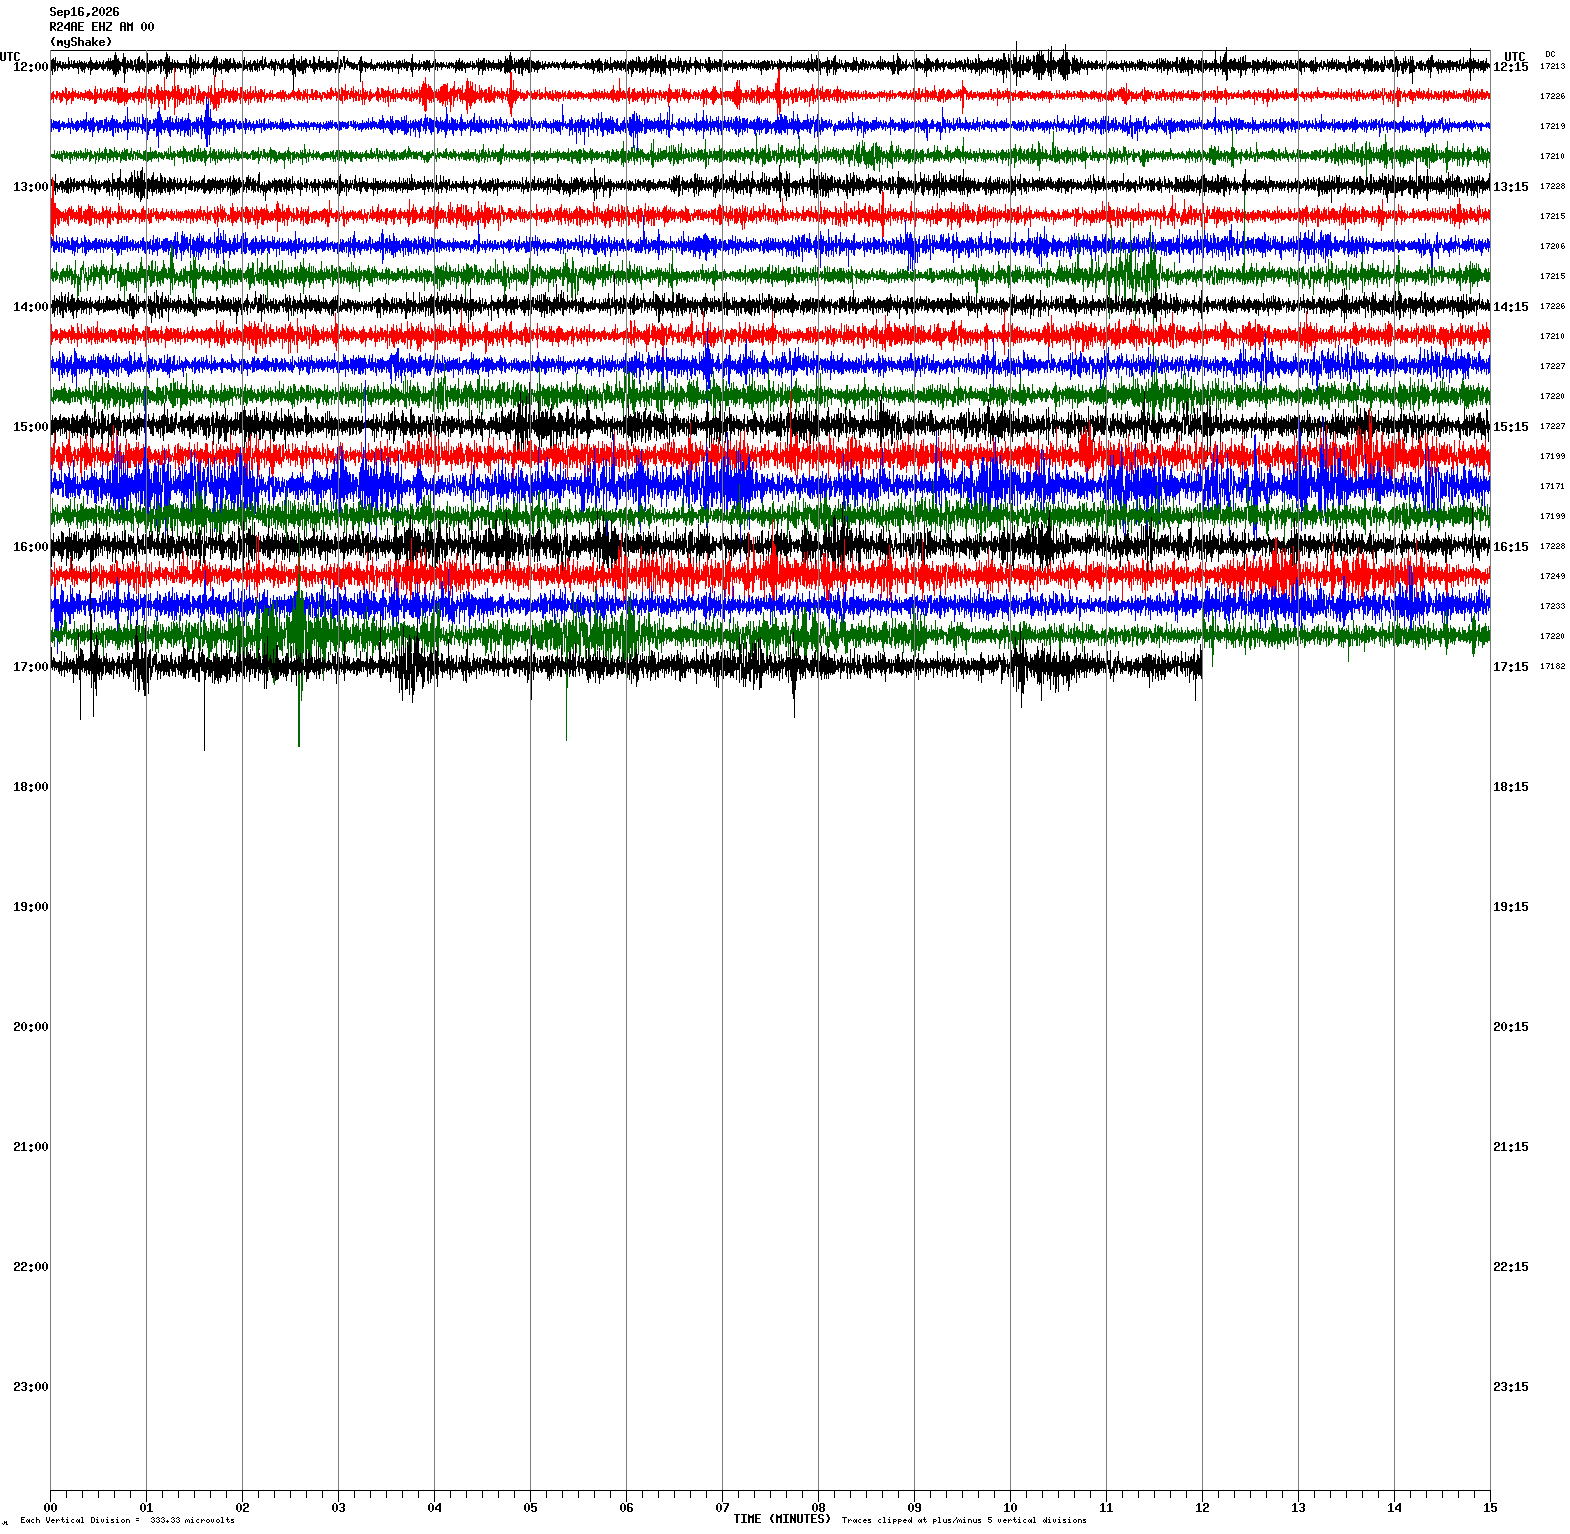
Each line is 15 minutes, four to an hour, so the plate is half a day. The color cycles black, red, blue, green to keep your eye in place and means nothing else; a trace past five divisions is clipped, drawn flat at the edge, so the biggest arrivals look square rather than tall.
Mostly not earthquakes
Almost everything here is people — traffic, trains, garbage trucks, wind on the roof — and you can read the working day off the bars at left, swelling from six in the morning and falling away after ten at night.
The markers are the exception: each comes from the USGS catalog, not the trace, drawn where a cataloged quake's P wave should have reached PAWeather HQ, at the second it should have arrived. A marker needs roughly M1.9 at ten miles, M3.6 at a hundred, M6.6 at seven thousand — a curve fitted to what this instrument has actually recorded, not chosen in advance.
Heliographs: Raspberry Shake AM.R24AE, this station. Event catalog and arrival geometry: USGS. Don’t use this information to make consequential decisions.
Recentlyeverything marked on this seismograph in the last 60 days · live from USGS
- —Asking USGS what has happened lately…
The same curve that decides the markers, so a row followed to its plate has a marker waiting on it. Times are the instrument’s own; the link goes to the half day the wave arrived on, which for a distant quake late in a half day is the next plate rather than its own.
The ground’s half dayhow much ink each quarter hour took the plate above, in local time at the instrument
Seven years of itweekdays, against the level before March 2020 · one dot a day, October 2019 to today
Every weekday since this instrument was switched on, measured the same way from its own drum plots and drawn against the level it recorded before March 2020 — a ratio, because the underlying count is uncalibrated and a number on this axis would be read as a measurement of something. The step down in the third week of March 2020 is shelter‑in‑place: the ground under Palo Alto went 26 % quieter in the daytime and stayed down for about two months. It came back — 2026 weekdays run at 102 % of the old level — but the shape of the notch is unmistakable, and nothing else in seven years looks like it. The Shake’s plotting software changed on 31 March 2020, in the middle of that window; it is not the cause, because the same drop is already there in the fortnight before the change, measured on the old plots, and the fortnights either side of it read 74 % and 73 % — the same to within a point.
The week
Each day against the busiest, last twelve months
Sunday is the quietest day of the week here by a wide margin — 51 % of a Tuesday. Every late December notches down the same way, and so does the Fourth of July.
The quietest days on file
Out of 2516 measured, against a pre‑2020 weekday
- Apr 5, 2020Sunday · shelter-in-place41%
- Apr 12, 2020Sunday · shelter-in-place41%
- Dec 25, 2022Sunday · Christmas Day41%
- Mar 29, 2020Sunday · shelter-in-place42%
- Dec 25, 2023Monday · Christmas Day42%
- Apr 19, 2020Sunday · shelter-in-place42%
Four shelter-in-place Sundays and two Christmas mornings. Nothing in the record is quieter than the first.
Measured from 2516 archived heliographs, one per day. A proxy for ground motion, not a calibrated record.