Earthquakes & Seismograph
Within 100 miles12 in the last 60 days
- 3.327 km WSW of Westley, CA36 mi E ·
- 2.510 km ENE of Milpitas, CA17 mi E ·
- 3.09 km SW of Brentwood, CA35 mi NNE ·
- 1.71 km ENE of Woodside, CA7 mi W ·
- 1.81 km E of Woodside, CA7 mi W ·
- 2.51 km ESE of Woodside, CA7 mi W ·
- 3.19 km ENE of Blackhawk, CA34 mi NNE ·
- 1.83 km NNE of Portola Valley, CA6 mi WSW ·
- 1.93 km NNE of Portola Valley, CA6 mi WSW ·
- 2.84 km N of San Leandro, CA23 mi N ·
- 3.83 km N of San Leandro, CA22 mi N ·
- 3.96 km NW of Pinnacles, CA78 mi SE ·
Farther away12 in the last 60 days
- 4.897 km W of Petrolia, CA273 mi NW ·
- 5.4231 km WSW of Port McNeill, Canada960 mi NNW ·
- 6.680 km ENE of Tadine, New Caledonia6,056 mi WSW ·
- 6.5177 km W of Nikolski, Alaska2,570 mi NW ·
- 5.3off the coast of Oregon551 mi NW ·
- 6.389 km SSW of Nikolski, Alaska2,476 mi NW ·
- 4.785 km W of Petrolia, CA269 mi NW ·
- 6.735 km ENE of Tambo, Peru4,778 mi SE ·
- 6.99 km WNW of Pematangsiantar, Indonesia8,600 mi NW ·
- 7.866 km NNW of Ende, Indonesia8,019 mi W ·
- 7.42 km SE of San José del Palmar, Colombia3,659 mi ESE ·
- 4.9125 km WSW of Port Orford, Oregon400 mi NNW ·
Where they were
Where they were
North up, the station at the center, distance on a log scale. A dot’s size is its magnitude; every dot opens its earthquake on the seismograph.
The earthquakes listed
Every earthquake in the USGS catalog that was large enough, for its distance, to write on this seismograph. Choose one to see it on the record below, on the half day its wave arrived.
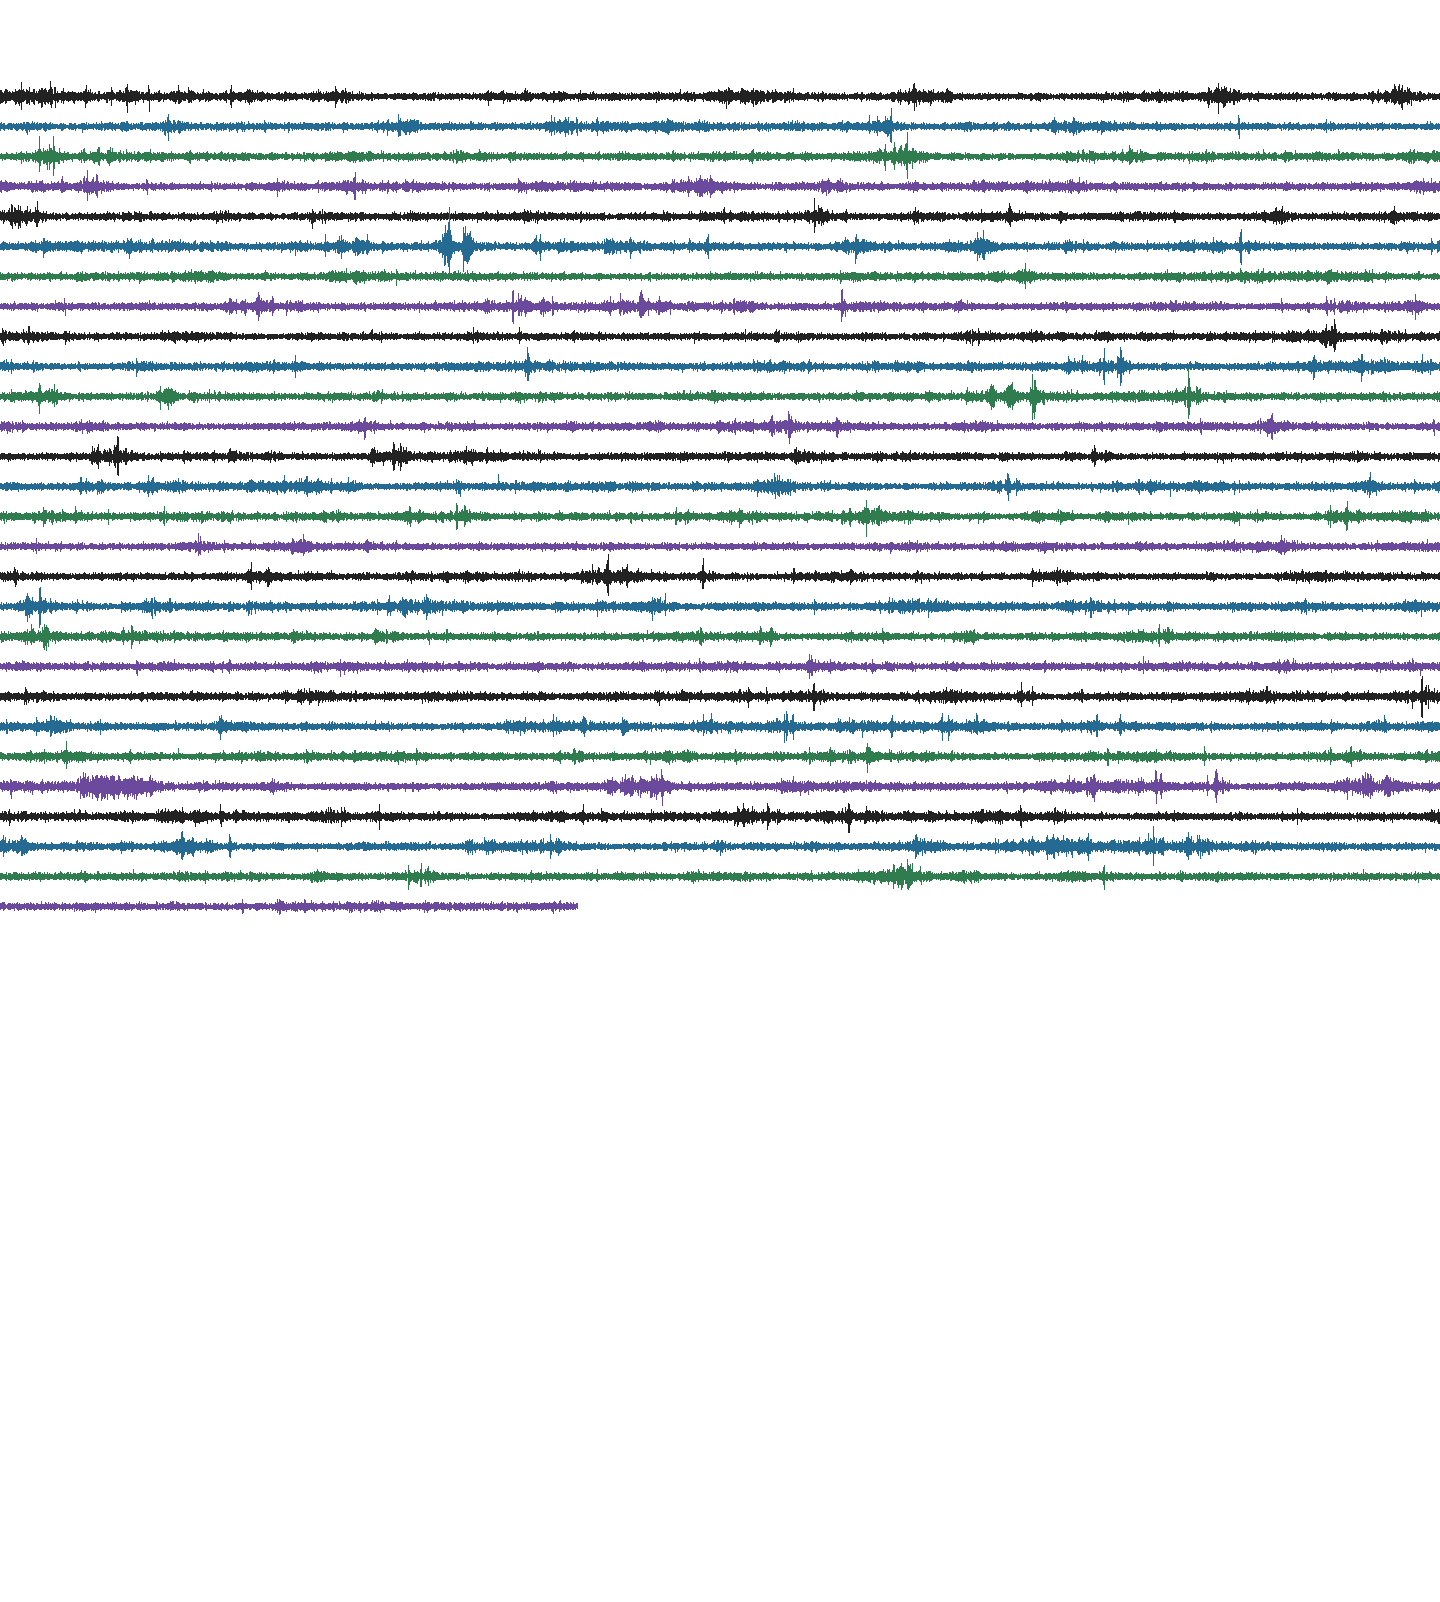
On the seismographAM.R24AE · three axes · 100 samples a second · one line every 15 minutes
Reading the seismograph
How to read it
Each line is 15 minutes, four to an hour, so the plate is half a day. A line’s color is the quarter hour it begins on, to keep your eye in place; red is kept for the earthquakes. A swing more than three lines tall is clipped, drawn flat at the edge, so the biggest arrivals look square rather than tall.
The markers
Every earthquake USGS locates gets a marker on the trace, drawn at the second its P wave should have reached this station; a marker opens a card about that earthquake. A marker needs roughly M1.9 at ten miles, M3.6 at a hundred, M6.6 at seven thousand — a curve fitted to what this instrument has actually recorded, not chosen in advance.
The three axes
The instrumentRecording
The earthquakes, and the instrument
This seismograph has recorded earthquakes in and around Palo Alto since October 2019 — the Hayward, San Ramon and Boulder Creek earthquakes of 2025 and 2026 among the local ones, and distant earthquakes as large as the M7.0 off Cape Mendocino in December 2024. A local earthquake is unmistakable: a sharp burst that stands well above the day’s traffic, often on all three axes at once. A large earthquake far away arrives minutes after it happened, as long slow waves that can run across several lines of the plate.
Each marker’s card gives the earthquake’s magnitude, place, distance and depth, how long its waves took to get here, and what people who felt it reported to USGS. And when an earthquake was probably felt in Palo Alto, every page of this site says so in a band under the menu, with a link to the earthquake here.
The rest of the ink is people — traffic, trains, garbage trucks, wind on the roof — and you can read the working day off the bars beside the plate, swelling from six in the morning and falling away after ten at night.
Close-up
EHZThe arrival at the plot’s full resolution, two and a half times what the plate shows.
Heliographs: Raspberry Shake AM.R24AE, this station. Event catalog and arrival geometry: USGS. Don’t use this information to make consequential decisions.
The ground’s half dayhow much ink each quarter hour took the plate above, in local time at the instrument
The ground’s half day
Seven years of itweekdays, against the level before March 2020 · one dot a day, October 2019 to today
Seven years of it
Every weekday since this instrument was switched on, measured the same way from its own drum plots and drawn against the level it recorded before March 2020 — a ratio, because the underlying count is uncalibrated and a number on this axis would be read as a measurement of something. The step down in the third week of March 2020 is shelter‑in‑place: the ground under Palo Alto went 26 % quieter in the daytime and stayed down for about two months. It came back — 2026 weekdays run at 102 % of the old level — but the shape of the notch is unmistakable, and nothing else in seven years looks like it. The Shake’s plotting software changed on 31 March 2020, in the middle of that window; it is not the cause, because the same drop is already there in the fortnight before the change, measured on the old plots, and the fortnights either side of it read 74 % and 73 % — the same to within a point.
The week
Each day against the busiest, last twelve months
Sunday is the quietest day of the week here by a wide margin — 51 % of a Tuesday. Every late December notches down the same way, and so does the Fourth of July.
The quietest days on file
Out of 2535 measured, against a pre‑2020 weekday
- Apr 5, 2020Sunday · shelter-in-place41%
- Apr 12, 2020Sunday · shelter-in-place41%
- Dec 25, 2022Sunday · Christmas Day41%
- Mar 29, 2020Sunday · shelter-in-place42%
- Dec 25, 2023Monday · Christmas Day42%
- Apr 19, 2020Sunday · shelter-in-place42%
Four shelter-in-place Sundays and two Christmas mornings. Nothing in the record is quieter than the first.
Measured from 2535 archived heliographs, one per day. A proxy for ground motion, not a calibrated record.